Is Azure a tier 3 datacenter? And what about Service Levels in a broader sense…

Introduction

Everyone who has been working with cloud, and involved with tenders, has had the follow question (in one form or another) ; “Has the cloud datacenter achieved a tier 3 (or higher) classification? In today’s post we will delve into the specifics linked to the ask ; Why do organizations ask the question, and how does it related to cloud?

What is a “Tier 3 Datacenter”?

To better understand the concept of data-center tiers, it is important to understand that several organizations (like the Telecommunications Industry Association (TIA) and the Uptime Institute) have defined standards for data-centers.

Uptime Institute created the standard Tier Classification System as a means to effectively evaluate data center infrastructure in terms of a business’ requirements for system availability. The Tier Classification System provides the data center industry with a consistent method to compare typically unique, customized facilities based on expected site infrastructure performance, or uptime. Furthermore, Tiers enables companies to align their data center infrastructure investment with business goals specific to growth and technology strategies.
Source ; https://uptimeinstitute.com/tiers

Which typically consists of several tiers…

Four tiers are defined by the Uptime Institute :

  • Tier I : lacks redundant IT equipment, with 99.671% availability, maximum of 1729 minutes annual downtime
  • Tier II : adds redundant infrastructure, with 99.741% availability (1361 minutes)
  • Tier III : adds more data paths, duplicate equipment, and that all IT equipment must be dual-powered, with 99.982% availability (95 minutes)
  • Tier IV : all cooling equipment is independently dual-powered; adds Fault-tolerance, with 99.995% availability (26 minutes)

Source ; https://en.wikipedia.org/wiki/Data_center#Uptime_Institute_-_Data_Center_Tier_Standards 

So it is a classification for organizations to understand the quality of the data-center, and be able to take a given availability into account. Though it is important to understand, that this relates to “datacenter housing” (colocation) and not to the cloud service models! Why is this statement important? As on top of that housing, additional services will be delivered by cloud providers to achieve service models like IaaS, PaaS, SaaS, …

UPDATE (2020) ; Azure Datacenter Tier = Higher than Uptime “Tier IV” Institute’s DC Tier standard

In the following document the datacenter classifications have been documented (Link updated in 2021; https://azure.microsoft.com/mediahandler/files/resourcefiles/azure-standard-response-to-rfi-on-security-privacy-and-compliance/Azure%20-%20Standard%20Response%20for%20Request%20for%20Information%20-%20Compliance%20Privacy%20and%20Security.pdf

From generation 1 the datacenters have been designed to meet the customer SLAs and service needs of 99,999%. Given that a tier 4 datacenter is designed towards a customer SLA and service need of 99,995%, we can state that an Azure Datacenter exceeds the expectations of a tier 4 datacenter.

Continue reading “Is Azure a tier 3 datacenter? And what about Service Levels in a broader sense…”

Leveraging Azure Tags and Azure Graph for deploying to your Blue/Green environments

Introduction

For this post I am assuming you are pretty familiar with the concept of deployment strategies (if not check out this post by Etienne). Now these are typically seen from an application deployment level, where platforms (like for instance Kubernetes) typically have out-of-the box mechanisms in place to do this. Now what if you would want to do this on an “infrastructure level”, like for instance the Kubernetes version of Azure Kubernetes Service. We could do an in-place upgrade, which will carefully cordon and drain the nodes. Though what if things go bad? We could do a Canary, Blue/Green, A/B, Shadow, … on cluster level too? Though how would we tackle the infrastructure point of view of this? That is the base for today’s post!


Architecture at hand

For today’s post we’ll leverage the following high level architecture ;

This project leverages Terraform under the hood. Things like DNS, Traffic Manager, Key Vault, CosmosDB, etc are “statefull’ where its lifecycle is fully managed by Terraform. On the other hand, our kubernetes clusters are “stateless” from an Infrastructure-as-Code point-of-view. We deploy them via Terraform, though do not keep track of them… All the lifecycle management is done on operating on the associated tags afterwards.


Community-Tool-of-the-day

The drawing above was not created in Visio for once. The above was made leveraging CloudSkew, which was created by Mithun Shanbhag. Always awesome to see community contributions, which we can only applaud!

Continue reading “Leveraging Azure Tags and Azure Graph for deploying to your Blue/Green environments”

Landscaping a Secure/Closed Loop Infrastructure in Azure with Terraform & Azure Devops

Introduction

Posts about security are always the ones that make everyone get really excited… Or maybe not everyone. 😉 Anyhow, what is typically the weakest link in any security design? Indeed, the human touch… The effects of this can range from having seen secrets to creating drift (unwanted changes vs de expected baseline). In today’s post, I’ll walk you through an example setup that aims to close some additional holes for you. How will we be doing this? By basically automating the entire infrastructure management with Azure Devops & Terraform. Now you’ll probably think, what does that have to do with security? Good response! We’re going to reduce the points to where human contact can interfere with our security measures. Though we want to do this without putting our agility at risk!


Blueprint

For this exercise, we’re going to leverage this blueprint ;

Continue reading “Landscaping a Secure/Closed Loop Infrastructure in Azure with Terraform & Azure Devops”

Comparing Costs : Is Cloud more expensive than an On Premises setup?

Introduction

In my role as a Cloud Solution Architect, I’m often faced with the statement that cloud is expensive. My reply is always that Cloud is not expensive (more expensive than On Premises) if you take into account all the costs involved. As this is an easy statement to make… I made an effort to create a cost comparison for four different scenario’s (in term of deployment size) and stacked “OnPremises” vs “Cloud”.

apple-orange-compare

In this post we’ll discuss this calculation and ensure that we are comparing apples to apples!


Design Decisions

Continue reading “Comparing Costs : Is Cloud more expensive than an On Premises setup?”

TLC Nand : The demise of enterprise spinning disks?

Last week during the Dell Tech Summit I got the privilege of seeing the plans they have for the future in terms of storage. One of the aspects (which I am allowed to disclose) is the usage of the new “3D XPoint” / “TLC Nand” technology in their storage lines. The technology has a lot of potential when you take a deeper look at it… Here I must say, that when I take a look at the pricing range the products will be inserted, then I really wonder what the purpose of the 15k spinning disks will be. Even, if the technology will get optimized a bit further, which will result in price drops, then I even wonder if the 10k disks will also have entered the list of endangered species!

2000651520

Eventually, it is my personal opinion that the 7,2k disks will become the mainstream storage for data that is infrequently accessed and that other data will be classified between several grades of SSD disks. This will mean that there will even be tiering between different classifications of SSD disks! Where the final resting location of the data will be the slow 7,2k spinning disks. And if more technology advances will be made that will make the SSD disks even more dense, than the ones I have currently seen in the roadmap, then we might even wonder if the spinning disks in general have become endangered (in enterprise context!).

dell_tlc_3d_flash_drive_small

Windows Storage Performance Benchmarking : a predefined set of benchmarks & analytics!

Introduction
A while ago we were looking into a way to benchmark storage performance on Windows systems. This started out with the objective to see how Storage Spaces held up under certain configurations and eventually moved towards us benchmarking existing OnPremise workloads to Azure deployments. For this we created a wrapper script for SQLIO that was heavily based upon previous work from both Jose Baretto & Mikael Nystrom. Adaptations were made to make it a bit more clean in code and to have a back-end for visualization purposes. At this point, I feel that the tool has a certain level of maturity that it can be publically shared for everyone to use.

Storage Performance Benchmarker Script
The first component is the “Storage Performance Benchmarker Script“, which you can download from the following location ; https://bitbucket.org/kvaes/storage-performance-benchmarker

I won’t be quoting all the options/parameters, as the BitBucket page clearly describes this. By default it will do a “quick test” (-QuickTest true). This will trigger one run (with 16 outstanding IO) for four scenario’s ; LargeIO Read, SmallIO Read, LargeIO Write & SmallIO Write.

The difference between the “Read” & “Write” part will be clear I presume… 🙂 The difference between the “LargeIO” & “SmallIO” reside in the block size (8Kbyte for SmallIO, 512Kbyte for LargeIO) and the access method (Random for SmallIO & Sequential for LargeIO). The tests are foreseen to mimmick a typical database behaviour (SmallIO) and a large datastore / backup workload (LargeIO). When doing an “extended test” (-QuickTest false), a multitude of runs will be foreseen to benchmark different “Outstanding IO” scenario’s.

Website Backend
You can choose not to send the information (-TestShareBenchmarks false) and the information will not be sent to the backend server. Then you will only have the csv output, as the backend system is used to parse the information into charts for you ; Example.

2015-08-20 07_40_02-Storage Performance Benchmarker [kvaes.be]

By default, your information will be shown publically, though you can choose to have a private link (-Private true) and even have the link emailed to you (-Email you@domain.tld).

On the backend, you will have the option to see individual test scenarios (-TestScenario *identifying name*) and to compare all scenarios against each other.

For each benchmark scenario, you will see the following graphs ;

  • MB/s : The throughput measured in MB/s. This is often the metric people know… Though be aware that the MB/s is realised by multiplying the IO/s times the block size. So the “SmallIO” test will show a smaller throughput compared to the “LargeIO”, though the processing power (IOPS or IO/s) of the “SmallIO” may sometimes be even better on certain systems.
    chart-55d567c06e74f
  • IO/S : This is the number of IOPS measured during the test. This provides you with an insight into the amount requests a system can handle concurrently. The higher the number, the better… To provide assistance, marker zones were added o indicate what other systems typically reach. This to provide you with an insight about what is to be expected or to which you can reference.
    chart-55d567cadcb77
  • Latency : This is the latency that was measured in milliseconds. Marker zones are added to this chart to indicate what is to be considered a healthy, risk or bad zone.
    chart-55d567d16f7e3

The X-axis will show the difference between different “Outstanding IO” situations ;

Number of outstanding I/O requests per thread. When attempting to determine the capacity of a given volume or set of volumes, start with a reasonable number for this and increase until disk saturation is reached (that is, latency starts to increase without an additional increase in throughput or IOPs). Common values for this are 8, 16, 32, 64, and 128. Keep in mind that this setting is the number of outstanding I/Os per thread. (Source)

Microsoft Azure : Budget Automation for your Development / Test Environment

Billing-per-minute

What is one of the biggest business advantages of Azure? You are only charge for your actual usage per minute.  For many organizations, the cost of a development/test environment is a sore spot as this costs a handful of cash. Today will introduce you to Azure Automation, which will let you orchestrate things, as stopping/starting your environment.

What are we going to do?

  • Setup a dedicated account for our scheduled runbooks
  • Configure two runbooks ; “stop all servers” & “start all servers”
  • Schedule those runbooks


Setup a dedicated account for our scheduled runbooks

In my opinion, you always needs to set up dedicated accounts for services. They should not be running under anyones “personal” account. At a given point they will leave the company. At that time, if the system is still active and the user account will be decommissioned, the system will cease to halt. In addition, this will also give you a traceability of the actions of the given service.

So how do you setup a dedicated account for the scheduled runbooks? Check the following post ; Azure Automation: Authenticating to Azure using Azure Active Directory

In summary, the steps you will need to do ;

  • Create an additional user in your Azure Active Directory
    2015-01-27 08_15_14-Active Directory - Windows Azure
  • Add the user as a co-administrator to your account2015-01-27 08_13_21-Settings - Windows Azure

It’s also advised to note down both the full username (dixit, username@account.onmicrosoft.com) and the password you have assigned. After the creation, be sure to login with the account. You will be asked to change your password. If you “forget” (too lazy huh?) to do this step, you will get an authentication error when trying to use this account for your automations (So yes, I tried to be lazy too…).


Configure two runbooks ; “stop all servers” & “start all servers”

In this phase, we’ll do the following

  • Create the Automation account (“folder”) under the Runbooks will be stored
  • Create a “start all servers” runbook from the gallery
  • Create a “stop all servers” runbook from the gallery


Browse to “Automation”, select “Runbook” and then choose “From Gallery”

2015-01-27 08_21_38-Automation - Windows Azure


In the gallery, go to “VM Lifecycle Management”, and select “Azure Automation Workflow to Schedule starting of all Azure Virtual Machines”2015-01-27 08_22_12-Automation - Windows Azure

Press next, review the code. The code is pretty straight forward… But we’ll get into that later on.

2015-01-27 08_22_29-Automation - Windows Azure

Now enter the name of your runbook, and choose “Create a new automation account”. Give the account a name and choose your subscription & region.

2015-01-27 08_23_19-Automation - Windows Azure

Now we’ll repeat the process for the “stop all servers” runbook.

2015-01-27 08_28_22-Automation - Windows Azure 2015-01-27 08_28_37-Automation - Windows Azure 2015-01-27 08_28_49-Automation - Windows Azure

Now browse back to the “Automation” screen ;

2015-01-27 08_29_51-Automation - Windows Azure

Before we can go on with these steps, we’ll need to add our user to the “Assets” of our “Automation Account”. Browse to “Assets” and select “Add settings”.

2015-01-28 10_43_07-Automation - Windows Azure

Select “Add credential”… Then use “Windows Powershell Credential” as “Credential Type” and name the credential.

2015-01-28 10_43_34-Automation - Windows Azure

Now enter the user information you noted down earlier… and press save.

2015-01-28 10_44_32-Automation - Windows Azure

You are now good to go!

2015-01-28 10_42_48-Automation - Windows Azure

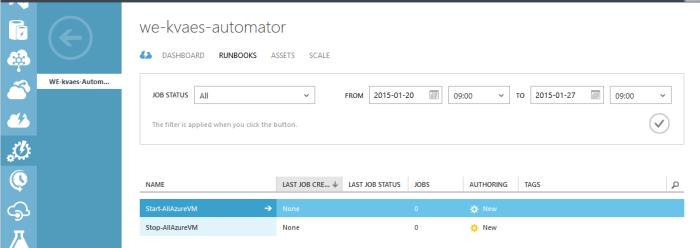
Select “Runbooks”, now you can see both runbooks we just created.


2015-01-27 08_30_09-Automation - Windows Azure

Select the “Stop-AllAzureVM” & adjust the two parameters and press save ;

  • -Name “username@domain.onmicrosoft.com”
  • -Subscriptionname “Subscription Name”

2015-01-27 08_30_48-Automation - Windows Azure

Select the “Start-AllAzureVM” & adjust the three parameters and press save ;

  • -Name “username@domain.onmicrosoft.com”
  • -Subscriptionname “Subscription Name”
  • -Name “Your Most Important Server”

2015-01-27 08_33_48-Automation - Windows Azure

What did we just do for both scripts? We entered the user account & subscription under which the script will be executed. This is a mandatory step and understandingly so. Now let us test the “StartAllAzureVM”-script… I’ve prepared two virtual machines, which are currently shutdown.

2015-01-27 08_34_03-Virtual machines - Windows Azure

So we’ll press “Test” on the runbook…

2015-01-27 08_34_20-Automation - Windows Azure

And yes, we are sure. Azure Automation will save the runbook one more time to be safe.

2015-01-27 08_34_33-Automation - Windows Azure


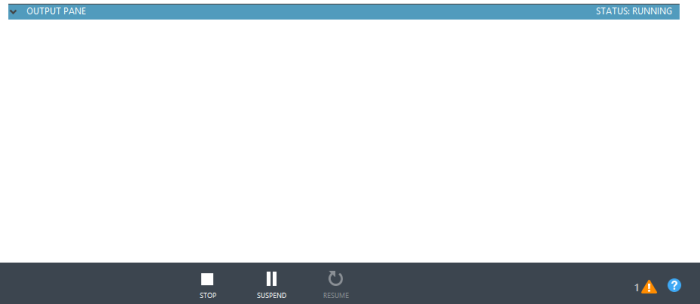
The output pane will show the status “starting”.

2015-01-27 08_34_52-Automation - Windows Azure

And it will change to “running” after a while.

2015-01-27 08_35_40-Automation - Windows Azure.

Once you see the code below, you will know that you have been authenticated. So all our hard work with creating the user paid off! If you do not see this, that is the part you should be debugging…

2015-01-27 08_35_56-Automation - Windows Azure

Suddenly our “most important server” will be showing the status “Starting”…

2015-01-27 08_36_31-Virtual machines - Windows Azure


And the output pane will verify this status!

2015-01-27 08_36_41-Automation - Windows Azure

So basically, we are safe to say that our script works. Let’s publish the runbooks so that we can schedule them later on.

2015-01-27 08_50_11-Edit Post ‹ Karim Vaes — WordPress


For each runbook, press the “publish”-button

2015-01-27 08_48_32-Automation - Windows Azure

We are sure, and you will see the runbook shift from “draft” to “published”.


2015-01-27 08_48_59-Automation - Windows Azure

Congrats so far! We are now ready to schedule those babies!


Schedule those runbooks

So which steps will we be doing in this phase?

  • Create two schedules ; “start of business day” & “end of business day”
  • Attach the “start” runbook to the “start of business day” schedule
  • Attach the “stop” runbook to the “end of business day” schedule


Let us start creating the two schedules ;


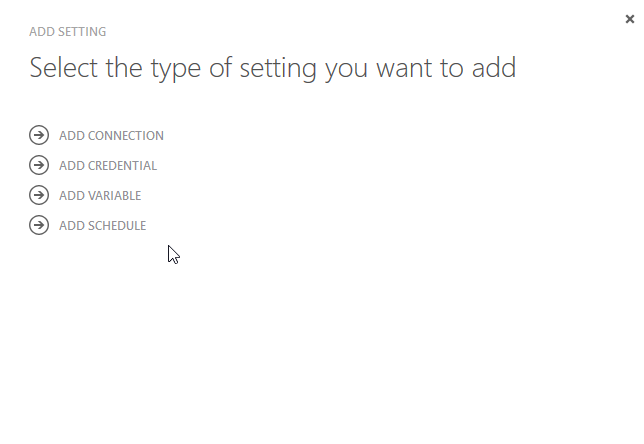
Go to our “Automation Account” and select “Assets”. Here you press the “Add Setting”-button.

2015-01-27 08_54_49-Automation - Windows Azure 2015-01-27 08_55_04-

Choose “Add Schedule”2015-01-27 08_55_16-Automation - Windows Azure

Enter the name…2015-01-27 08_55_28-Automation - Windows Azure

The schedule…2015-01-27 08_56_14-Automation - Windows Azure

Rince & repeat…

2015-01-27 08_58_01-Automation - Windows Azure

Now we have both schedules. One that will occur at 08:00 and another one that will occur at 17:00 (5pm). Now let’s link our runbooks…

Go to our “Automation Account”, and select “Runbooks”. Click on one of them

2015-01-27 09_01_15-Automation - Windows Azure

Go to “Schedule”, and press “Link to an existing schedule”.

2015-01-27 09_01_29-Automation - Windows Azure

Select the schedule…

2015-01-27 09_01_41-Automation - Windows Azure

And you will see the schedule attached.


2015-01-27 09_02_04-Automation - Windows Azure

Rince & repeat for the other one.


Summary

With the power of automation & a gallery of pre-made runbooks, we were able to save our business tons of money by only running the servers during the business hours. Be aware that the above example does not accompany holidays / weekends… In addition, the money saving is “limited” to the “compute”, as the storage of your devices will remain “active” (on disk).

Database variants explained : SQL or NoSQL? Is that really the question?

A first glance beyond the religion

When taking a look towards the landscape of databases, one can only accept that there has been a lot of commotion about “SQL vs NoSQL” in the last years. But what is it really about?

SQL, which stands for “Structured Query Language”, has been around since the seventies and is commonly used in relational databases. It consists of a data definition language to define the structure and a data manipulation language to alter the data within the structure. Therefore a RDBMS will have a defined structure and has been a common choice for the storage of information in new databases used for financial records, manufacturing and logistical information, personnel data, and other applications since the 1980s.

1401269083847

NoSQL, which stands for “Not only SQL”, departs from the standard relational model since it saw its first introduction in the nineties. The primary focus of these database was performance, or a given niche, and focus less consitency/transactions. These databases provide a mechanism for storage and retrieval of data that is modeled in means other than the tabular relations used in relational databases. Motivations for this approach include simplicity of design, horizontal scaling, and finer control over availability. The data structures used by NoSQL databases (e.g. key-value, graph, or document) differ from those used in relational databases, making some operations faster in NoSQL and others faster in relational databases. The particular suitability of a given NoSQL database depends on the problem it must solve.

So it depends on your need…

Do you want NoSQL, NoSQL, NoSQL or NoSQL?

NoSQL comes in various flavors. The most common types of NoSQL databases (as portrayed by Wikipedia) ;

There have been various approaches to classify NoSQL databases, each with different categories and subcategories. Because of the variety of approaches and overlaps it is difficult to get and maintain an overview of non-relational databases. Nevertheless, a basic classification is based on data model. A few examples in each category are:

  • Column: Accumulo, Cassandra, Druid, HBase, Vertica
  • Document: Clusterpoint, Apache CouchDB, Couchbase, MarkLogic, MongoDB, OrientDB
  • Key-value: Dynamo, FoundationDB, MemcacheDB, Redis, Riak, FairCom c-treeACE, Aerospike, OrientDB
  • Graph: Allegro, Neo4J, InfiniteGraph, OrientDB, Virtuoso, Stardog
  • Multi-model: OrientDB, FoundationDB, ArangoDB, Alchemy Database, CortexDB

Column

A column of a distributed data store is a NoSQL object of the lowest level in a keyspace. It is a tuple (a key-value pair) consisting of three elements:

  • Unique name: Used to reference the column
  • Value: The content of the column. It can have different types, like AsciiType, LongType, TimeUUIDType, UTF8Type among others.
  • Timestamp: The system timestamp used to determine the valid content.

Example

{
    street: {name: "street", value: "1234 x street", timestamp: 123456789},
    city: {name: "city", value: "san francisco", timestamp: 123456789},
    zip: {name: "zip", value: "94107", timestamp: 123456789},
}

Document

A document-oriented database is designed for storing, retrieving, and managing document-oriented information, also known as semi-structured data. The central concept of a document-oriented database is that Documents, in largely the usual English sense, contain vast amounts of data which can usefully be made available. Document-oriented database implementations differ widely in detail and functionality. Most accept documents in a variety of forms, and encapsulate them in a standardized internal format, while extracting at least some specific data items that are then associated with the document.

Example

<Article>
   <Author>
       <FirstName>Bob</FirstName>
       <Surname>Smith</Surname>
   </Author>
   <Abstract>This paper concerns....</Abstract>
   <Section n="1"><Title>Introduction</Title>
       <Para>...
   </Section>
 </Article>

Key-Value

A key-value (an associative array, map, symbol table,or dictionary) is an abstract data type composed of a collection of key/value pairs, such that each possible key appears just once in the collection.

Example

{
    "Pride and Prejudice": "Alice",
    "The Brothers Karamazov": "Pat",
    "Wuthering Heights": "Alice"
}

Graph

A graph database is a database that uses graph structures for semantic queries with nodes, edges, and properties to represent and store data. A graph database is any storage system that provides index-free adjacency. This means that every element contains a direct pointer to its adjacent elements and no index lookups are necessary. General graph databases that can store any graph are distinct from specialized graph databases such as triplestores and network databases.

Example

GraphDatabase_PropertyGraph

MultiModel

Most database management systems are organized around a single data model that determines how data can be organized, stored, and manipulated. In contrast, a multi-model database is designed to support multiple data models against a single, integrated backend. Document, graph, relational, and key-value models are examples of data models that may be supported by a multi-model database.

And what flavor do I want?

Each type and implementation has its own advantages… The following chart from Shankar Sahai provides a good overview ;

nosql-comparison-table

Any other considerations I should take into account?

Be wary that most implementations were not designed around consistency integrity and more towards performance. Transactions are referential integrity are not supported by most implementations. High availability designs (including on geographic level) are possible with some implementations, though this often implies a performance impact (as one would expect).

Also check out the research made by Altoros ;

5. Conclusion
As you can see, there is no perfect NoSQL database. Every database has its advantages and disadvantages that become more or less important depending on your preferences and the type of tasks.
For example, a database can demonstrate excellent performance, but once the amount of records exceeds a certain limit, the speed falls dramatically. It means that this particular solution can be good for moderate data loads and extremely fast computations, but it would not be suitable for jobs that require a lot of reads and writes. In addition, database performance also depends on the capacity of your hardware.

They did a very decent job in performance testing various implementations!

2015-01-21 09_08_23-A_Vendor_independent_Comparison_of_NoSQL_Databases_Cassandra_HBase_MongoDB_Riak.

The DTAP-Street : a phased approach to a development / deployment cycle

The acronym DTAP finds its origin in the words Development, Testing, Acceptance and Production. The DTAP-street is a commonly accepted method to have a phased approach to software development / deployment.

A typical flow works as follows :

  • Development – This environment is where the software is developed. It is the first environment that is used. Changes are very frequent here, as this is the first area where creativity is forged into a product.
  • Test – A developer is (hopefully) not alone. In the test environment, the complete code base is merged and forged into one single product. The first attempts at standardization and alignment towards the future production environment are made here.
  • Acceptation – Once the development team feels that the product is ready, it will be deployed to acceptance. This is a look-alike of the production and used by operations as a staging environment for production releases.
  • Production – The real deal… Here the product surely needs to be ready for prime-time.

dtap-kvaes.be-271014

Sometimes the following are also added ;

  • Education / Training – Sometimes a dedicated environment is needed where people can test drive the software in a safe sand box. Due to efficiency reasons, this environment is often time shared with acceptation.
  • Backup / Disaster Recovery – Disasters can happen… Therefore some disaster recovery plans may rely on a dedicated backup / disaster recovery location.
  • Integration – An environment that is sometimes located between “Test” & “Acceptance” as an intermediate step to test certain partner integrations. Just as with the “eduction” environment, this environment is often time shared with acceptation.

What are the most commonly used formations?

  • Live – Production – Many companies rely solely on a production environment. The risk reduction is often neglected in favor of the cost benefit of having one environment.
  • Staging – Production/Test – If no real customization are done to the implemented software, then two environments may suffice.
  • DTAP – Development/Test/Acceptation/Production – Once customization hit… then a full DTAP-street is needed to reduce the amount of risks involved with software development.
  • DTAPB – Development/Test/Acceptation/Production/Backup – This is an enhanced DTAP-street that is capable of doing a disaster recovery. (Sidenote ; The Test/Development environment is often shared with the backup location. This provides the advantage that the resources of the Test/Development can be sacrificed during a disaster.)

What Code / Data flows occur between the environments?

  • Software Versions – Software releases go from Development to Test to Acceptation to Production… The timing varies from the chose release management cycle, though typical times are as follows ; Development (Continuous Builds), Test (Daily Build), Acceptation (Once per quarter, three weeks before production), Production (Once per quarter)
  • Data – Data flows in the opposite direction as software versions. Data is taken from production and copied to Acceptance / Test / Development. Depending on the environment (and relative security compliancy), the data may be anonymized or even reduced to have a representative production workload of a limited size.

Lingo Explained : Technical Debt

What is technical debt?

A design or construction approach that’s expedient in the short term but that creates a technical context in which the same work will cost more to do later than it would cost to do now (including increased cost over time)

technical-debt-explained

Example

“Guys, we don’t have time to dot every i and cross every t on this release. Just get the code done. It doesn’t have to be perfect. We’ll fix it after we release.”

A quote from the past

“As an evolving program is continually changed, its complexity, reflecting deteriorating structure, increases unless work is done to maintain or reduce it.” — Meir Manny Lehman, 1980

Need a bit more info? Check out the presentation on technical debt at the International Conference on Software Engineering anno 2013 or Wikipedia.